It’s 2022, and frankly, it would be surprising if organizations today didn’t have some form of people analytics tools. Today, analytic tools are not only available to companies worldwide, but this “field truly exploded in power, depth, and widespread application, especially, but not only, in Human Resources (HR) management.” One area of human resources management that has seen (and used) these powerful analytics tools? Recruitment marketing.
Having access to data – and lots of it – is one thing. But how can companies make data actionable, allowing it to draw insights and trends and inform a recruitment strategy?
Far too often, data is visualized in Excel or PowerPoint charts, which can be unsettling given the importance of the data and the significance of clearly and effectively showcasing data to hiring professionals, leadership, or customers. Many professionals say that “data should tell a story.” Well, that’s easier said than done. Data visualizations are hard to create, let alone having recruitment professionals construct an entire dashboard full of meaningful graphs, charts, and widgets, proving proof of return on investment (ROI) to company leadership.
With data, hiring professionals can understand how their jobs perform and adjust when necessary. Also, having analytics allows recruitment professionals to have visibility at a granular level, which can ensure recruiting teams can make sense of the data and make the best decisions for the company.
Keep reading to learn more about creating actionable dashboards that allow faster and better decision-making, while telling a company’s recruitment story.
Consider The Why
When creating an actionable analytics dashboard, recruiters must first identify their “why.” Why is the dashboard needed? Who needs to use the dashboard? How are hiring professionals currently making recruitment decisions based on data? How effective are these recruitment decisions?
As with any project, understanding where hiring professionals currently stand while exploring where they need to go is critical when determining what insights their hiring team needs from the analytics and tracking. After all, valuable and actionable data insights can be created once recruiters know what they need.
This fundamental understanding of why hiring professionals build a dashboard will help form their overall dashboard objective. It guides them on what metrics to include, how often the data is updated, and how information is visualized. This data helps hiring professionals plan for future talent acquisition needs instead of shooting in the dark. The answer to “why” will be the dashboard’s core storytelling objective.
Understanding the metrics behind a company’s recruitment marketing results also empowers companies to manage and understand their current investments fully and plan more effectively for the future.
Choose The Right Metrics
Once hiring professionals understand why they’re building the dashboard, they can assess what metrics and key performance indicators (KPIs) should be included, tailoring the dashboard to meet the recruiting team’s objectives.
Tracking a company’s recruitment marketing results allows hiring professionals to make smarter media buying decisions. With the insights that come with a full view of a company’s recruitment marketing analytics, companies get empowered to set strategic and appropriate budgets per initiative to reach hiring goals, knowing how much it costs on average to generate an application to a specific job type.
Here are some metrics hiring professionals can use in their recruitment analytics dashboard.
High-Level KPIs
High-level KPIs are the top aggregated data points an organization needs to track. For example, a recruiting team may need to track the number of jobs sponsored, clicks, cost-per-click (CPC), applications received, apply rate, and cost-per-application (CPA) in real-time. If these metrics are a company’s high-level KPIs, then hiring professionals should exclusively highlight these metrics at the top of every dashboard to allow the recruiting team to gauge performance at a glance and in real-time.
-png.png)
Performance Timelines
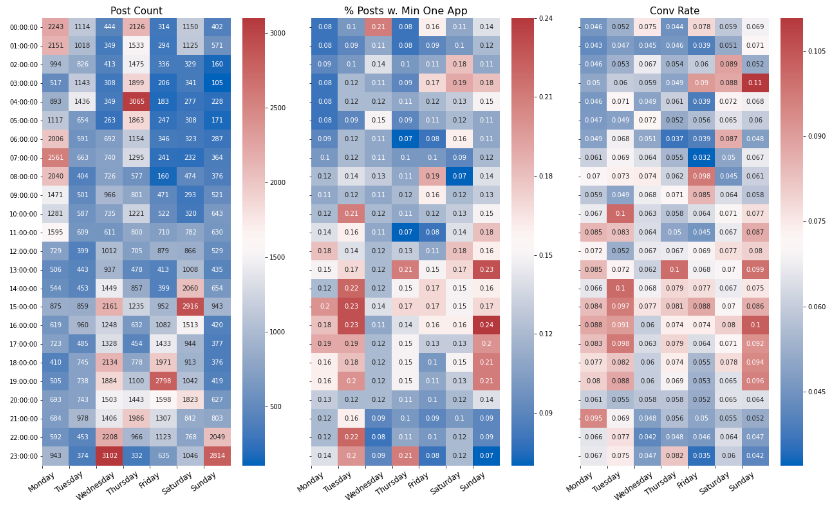
Recruiters can look at KPIs as they trend over time to develop a trend analysis. By examining day over day, week over week, month over month, or even year over year trends, a recruiting team can see comparison data in an easily identifiable manner. In addition, since performance is often looked at in chronological order, hiring professionals can easily make callouts for anomalies in the data and performance trends, indicating market conditions or a recruitment strategy’s effectiveness.

Drill-downs
High-level data will give hiring professionals a pulse on their recruitment advertising performance, but there are cases where data drill-downs are needed. For example, recruiters can drill down into the campaign – and job-level performance. If a hiring professional needs to see how a specific hard-to-fill req performed, then they’ll have access to search a drill-down table populated with individual job performance. The ability to drill down on particular data sets can be crucial for managing job-level performance and the overall strategic vision of the entire job portfolio.
Geolocation
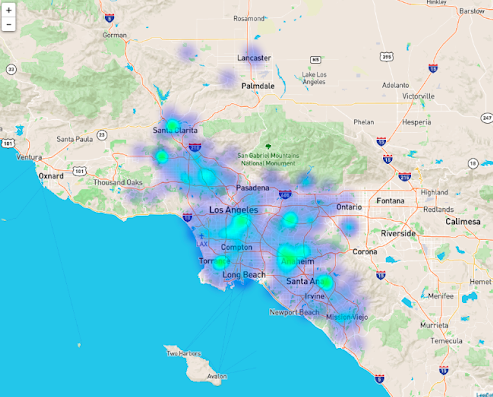
How a company’s jobs perform will vary from market to market. In most cases, the talent acquisition team advertises for positions in multiple markets, especially today with a distributed workforce. Getting a grasp on the different market benchmarks is crucial to understanding how to advertise for jobs across many geos strategically. Recruitment teams can use a heatmap to understand better how job searches are performing within different cities, states, or regions, giving quick visual feedback in real-time.

ROI
Hiring professionals need to tie this all back to a cost or value add. Is the data sharing that the recruitment advertising and marketing strategy is successful? Are recruiters able to accurately track success with a dollar figure? Determining a tipping point on what’s working and providing a healthy ROI is key to a dashboard’s objective, and this is a quick go-to callout to let hiring professionals know if the strategy works.
Create A Prototype
Before investing time in creating a dashboard, it’s helpful to sketch it out or create mockups of what the team wants the dashboard to look like. Going back to the idea that “data should tell a story,” the recruiting team wants to design the dashboard narratively. Generally, recruiters will have the KPI and ROI charts at the top, then funnel them into performance timelines and then granular data.
The dashboard layout is essential to creating an easy-to-understand flow that tells the performance story. It also helps the audience see the importance of the dashboard’s top-level visualizations, giving them insight into the baseline performance before getting too far into the weeds.

Perform A Stress Test
Next, hiring professionals must ensure that their ideal dashboard can withstand the data import.
Importing data from multiple data sources can get a little scary. There will be different data points, unstructured and structured data sets, and sometimes conflicting “success” benchmarks. This is normal, since data is sometimes messy – and the goal isn’t to get hung up on a data set that may not mesh well with others.
The goal is to get a generally cohesive story across the data sources; whether programmatic or social campaigns, hiring professionals want to understand how each data source performs.
If recruiters can mesh those into a roll-up view and determine success, they’re already one step ahead. If not, stress test how the data gets injected into the dashboard, and after a couple of months, determine if there are any patterns or trends, allowing recruiters to set a success benchmark.
Ensure Mobile Optimization
In today’s on-the-go, work from anywhere world, hiring professionals must ensure that the analytics dashboards are fully optimized for mobile. In addition, with so many hyper-connected communication tools, the recruiting team and leadership expect to have access to information 24/7/365.
With a mobile-optimized analytics dashboard, a company can analyze their data insights whenever and wherever they want.
Evaluate & Tweak
Once the dashboard is up and running for at least a couple of weeks, it’s time to check in to see if it’s working out. Is there a story to tell? Can hiring professionals look at the dashboard to get a temperature gauge on performance?
The answer should be yes to both of these questions. If the dashboard has not helped narrate a story or enabled hiring professionals to get quick pulse checks, it’s back to the drawing board. Think about the possible missteps and consider whether any part of the dashboard hinders the goal of showcasing a story that is easy to understand.
For example, with a deep understanding of the underlying analytics, hiring professionals can figure out which job sites are the most reliable when it comes to delivering quality candidates for different types of jobs. If, after over a year, recruiters identify that zero tech hires were made from one specific job site, they can conclude that they’re not attracting top tech talent from this source, and use that information to make more informed media buying decisions. This can help recruiting teams significantly reduce or stop spending altogether on tech jobs at that source -- freeing up budget for use on job types that are performing well using that particular site. Using end-to-end / down-funnel analytics, with cost per hire data (not just applications), recruitment professionals can analyze and better understand media source performance.
Recruiting teams wouldn’t be able to come to this conclusion without having a powerful platform in place. When working in this competitive labor market, “knowing the numbers” is now more critical than ever.
--
Recruitment marketing teams need to have a data-driven mindset. Using these six steps as a guide to building a dashboard, hiring professionals can have a competitive advantage in knowing the actual value of their recruitment marketing performance. With a well-built dashboard, recruiters will be able to tell and understand their recruitment data’s story.
Need assistance in creating your own recruitment marketing analytics dashboard? Feel free to reach out to the Recruitics team!


